Drowning in logs, alerts, and rigid tools? Meet Tenzir—your engine for taming security data. In just a few minutes, you’ll be ingesting, transforming, and enriching data on your terms, with full control. Here’s what you’ll accomplish:
- Use Tenzir instantly
- Deploy your first pipeline
- See results in action
Prerequisites
Section titled “Prerequisites”You need zero infrastructure to get started—just a browser and access to app.tenzir.com.
It helps if you have basic familiarity with logs or security telemetry, but it’s not required.
Setup & deploy a demo node
Section titled “Setup & deploy a demo node”Visit app.tenzir.com, sign in to create a free account, and you’ll see this page:
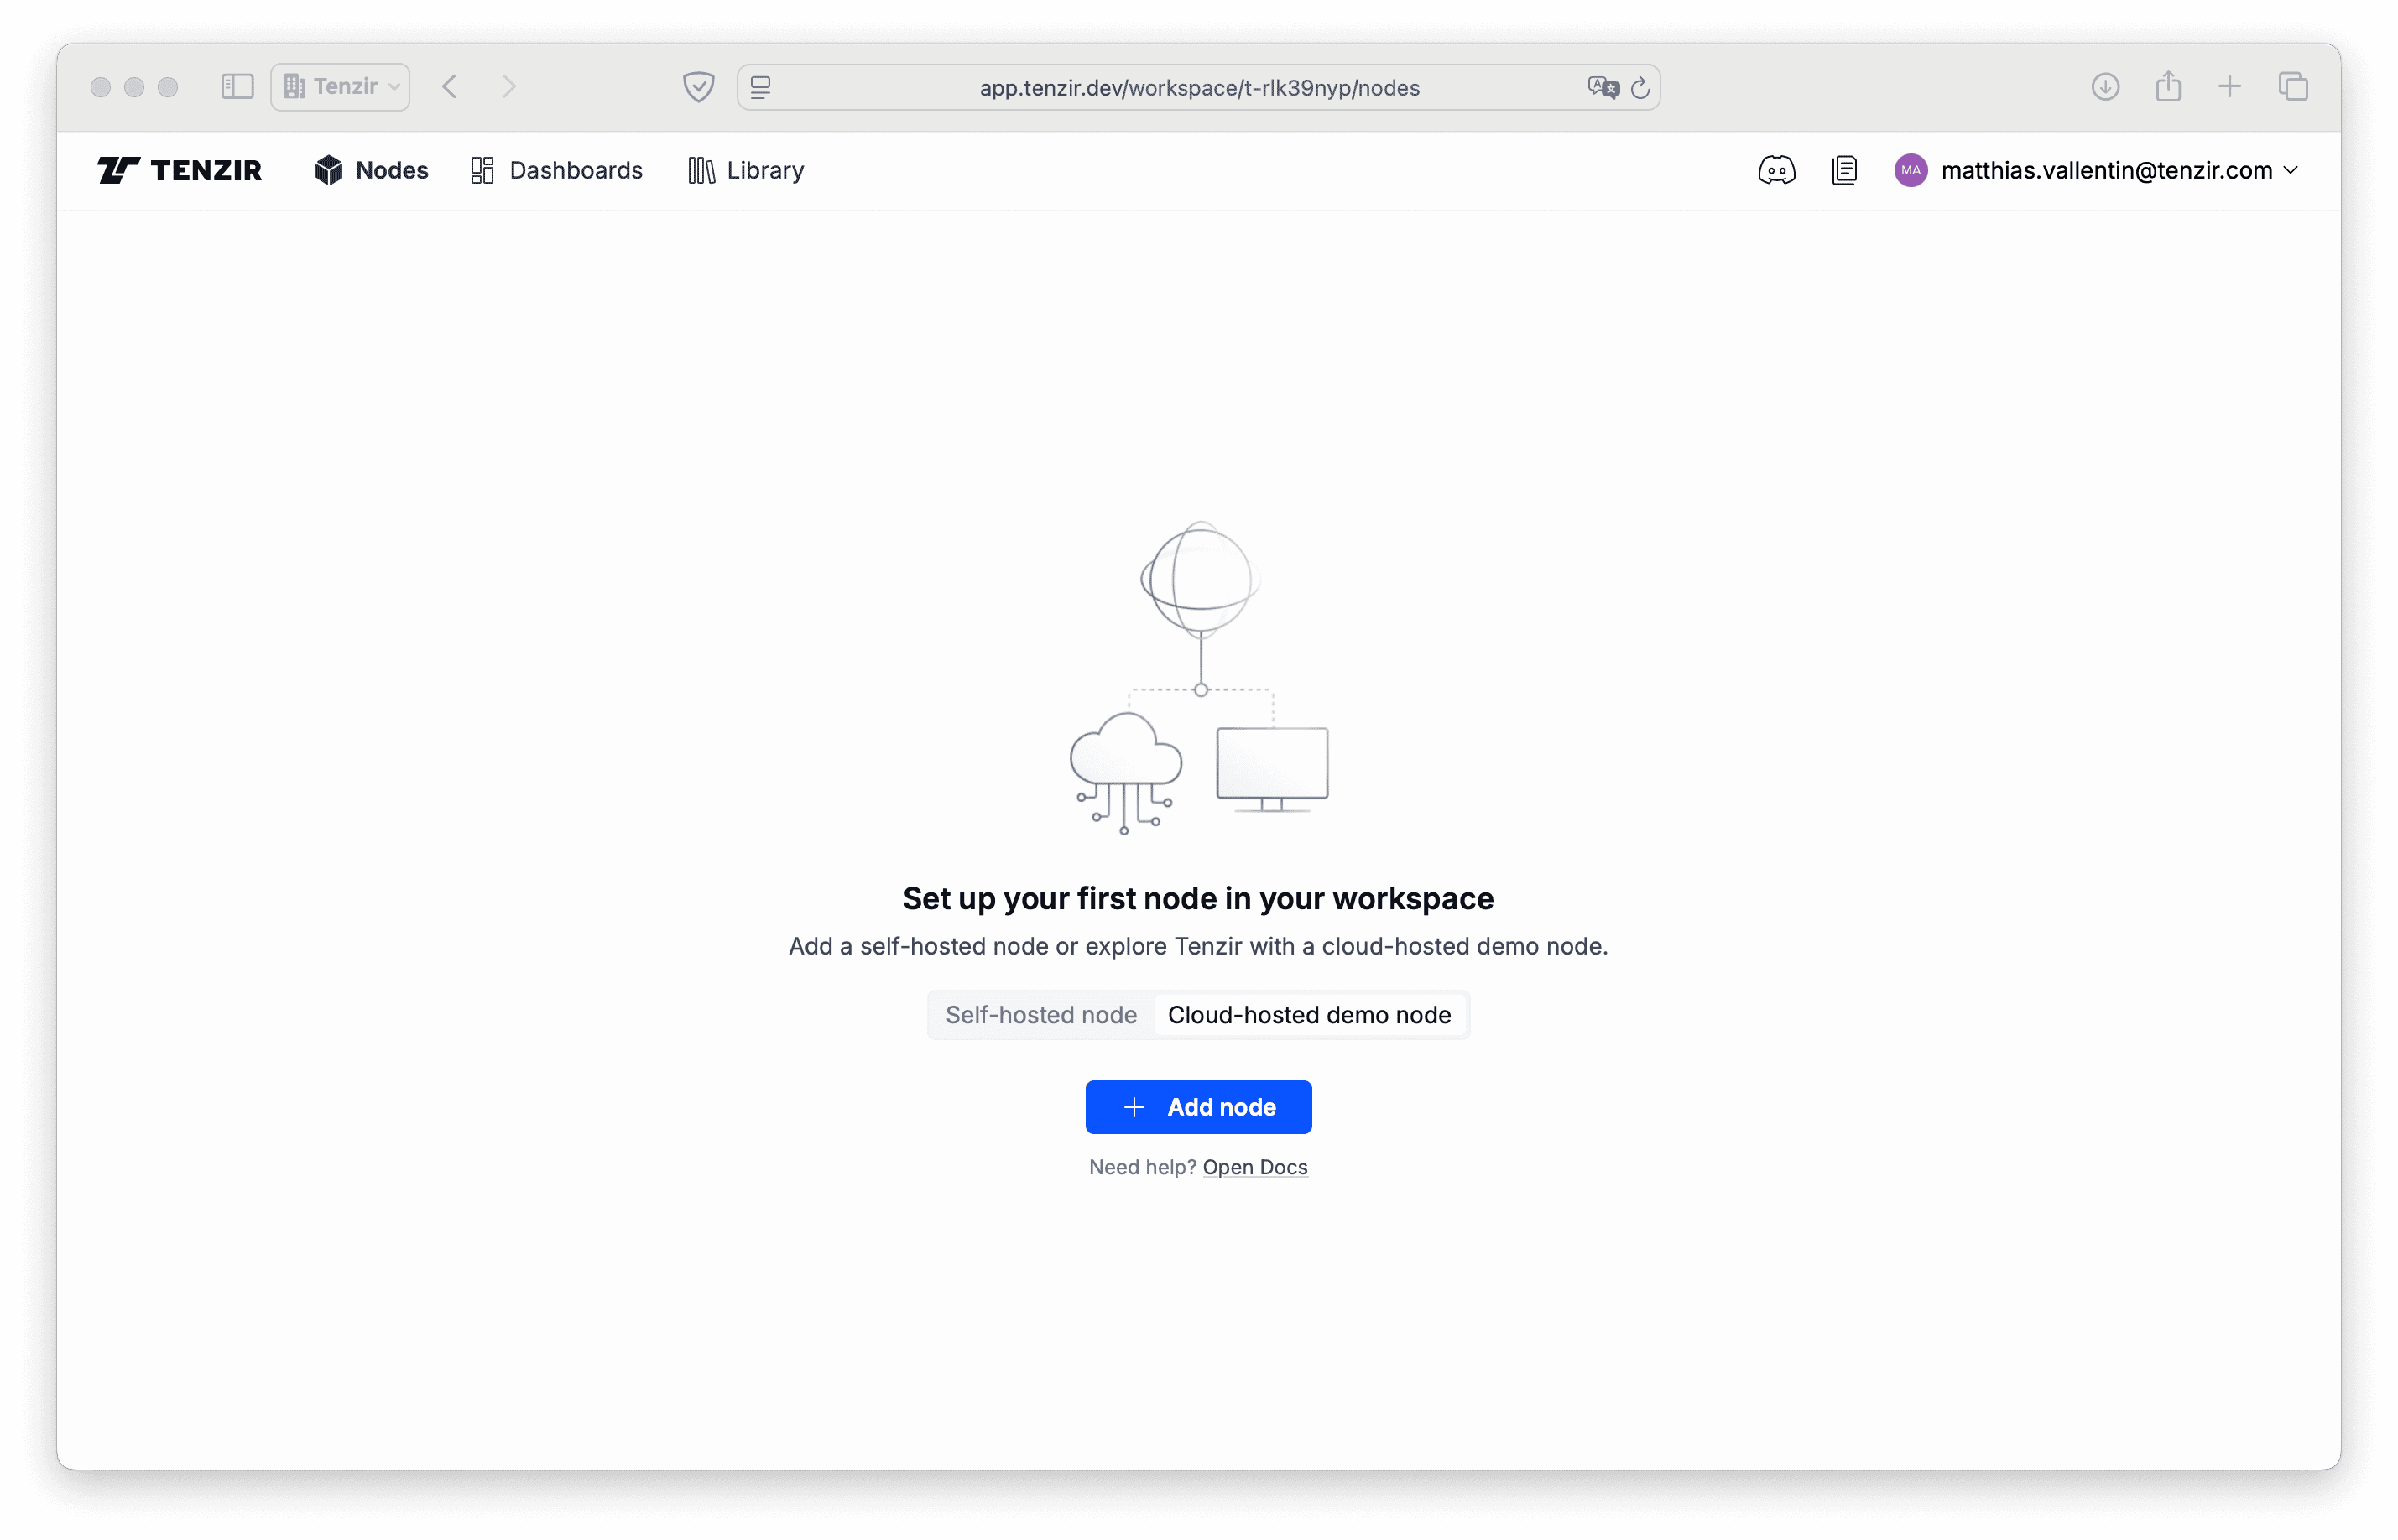
Begin with deploying a node:
- Select the Cloud-hosted demo-node tab.
- Click Add node.
- Click Get Started.
Spinning up a demo node can take up to 2 minutes. Sorry for the wait, we’ll cut down this time soon! Grab a coffee or learn more about the key Tenzir concepts while we get everything set up.
Get started with demo data
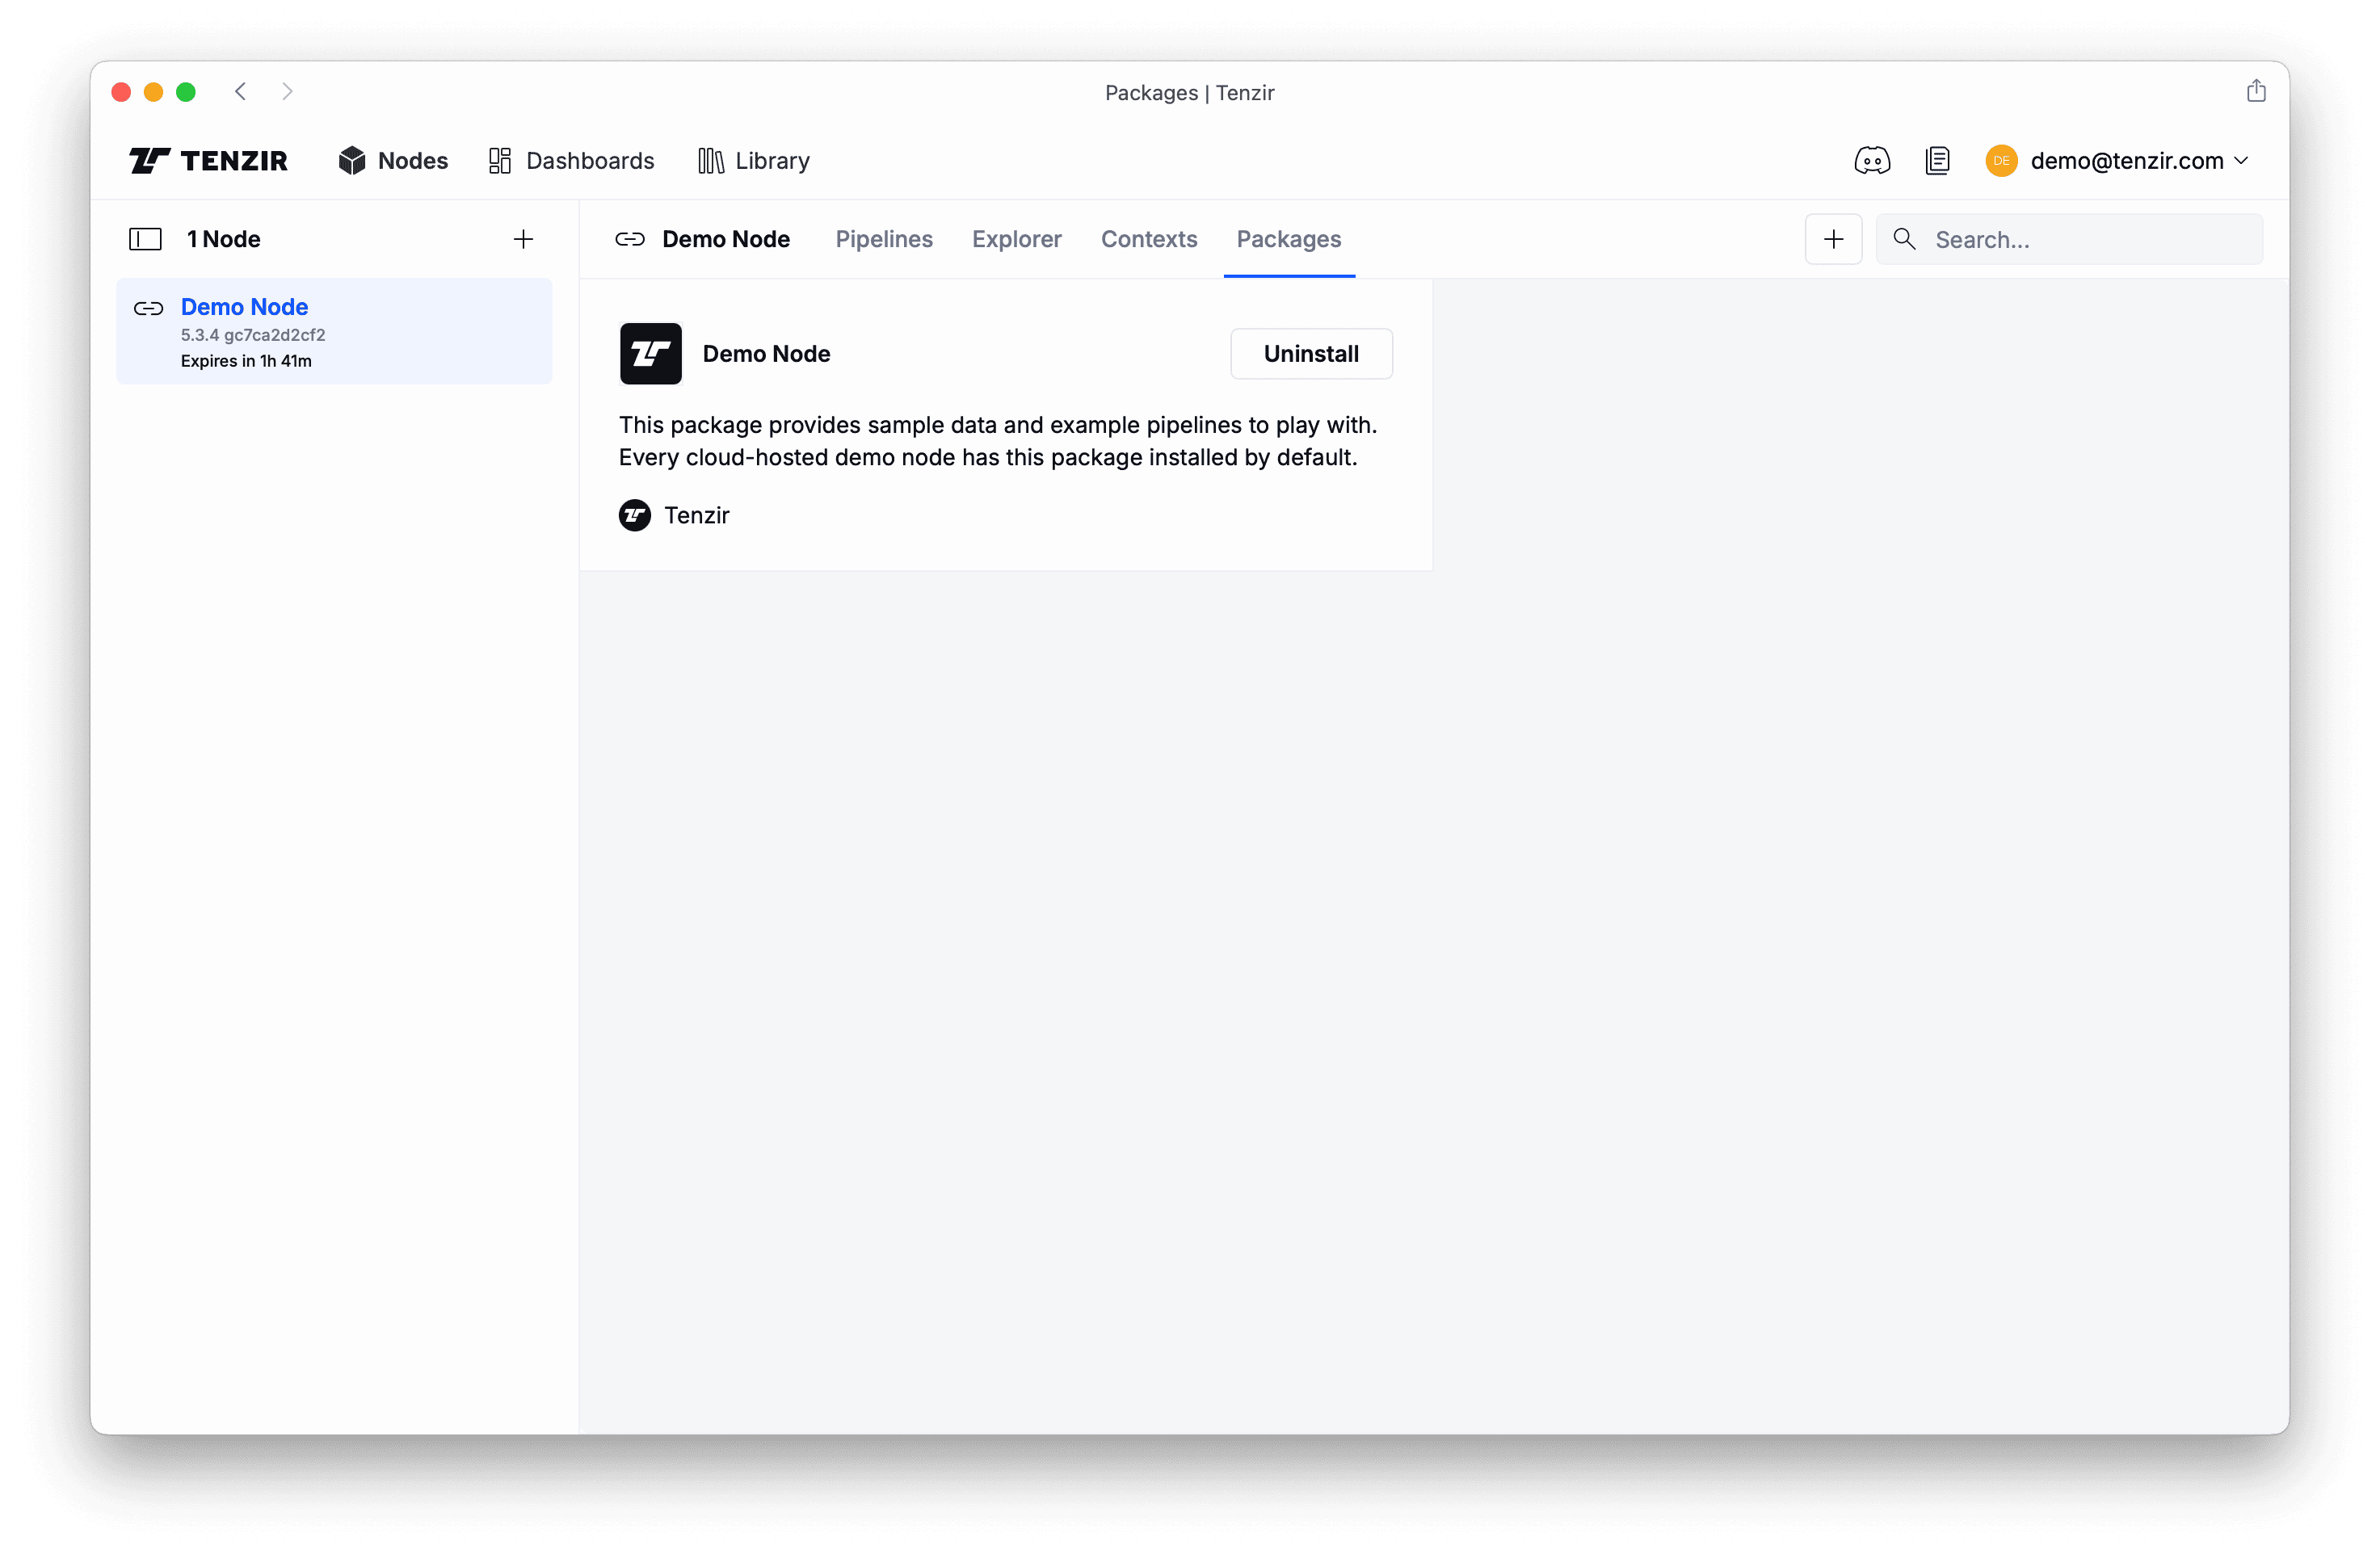
Section titled “Get started with demo data”Our demo nodes have the Demo Node package pre-installed, giving you sample pipelines that fetch data from a public cloud bucket and store it into the node’s edge storage. Once you have the sample data in the node, it will be simpler to work with it.
The Packages tab shows that the demo node package is installed:
When you go back to the Pipelines tab, you see the pipelines churning away:
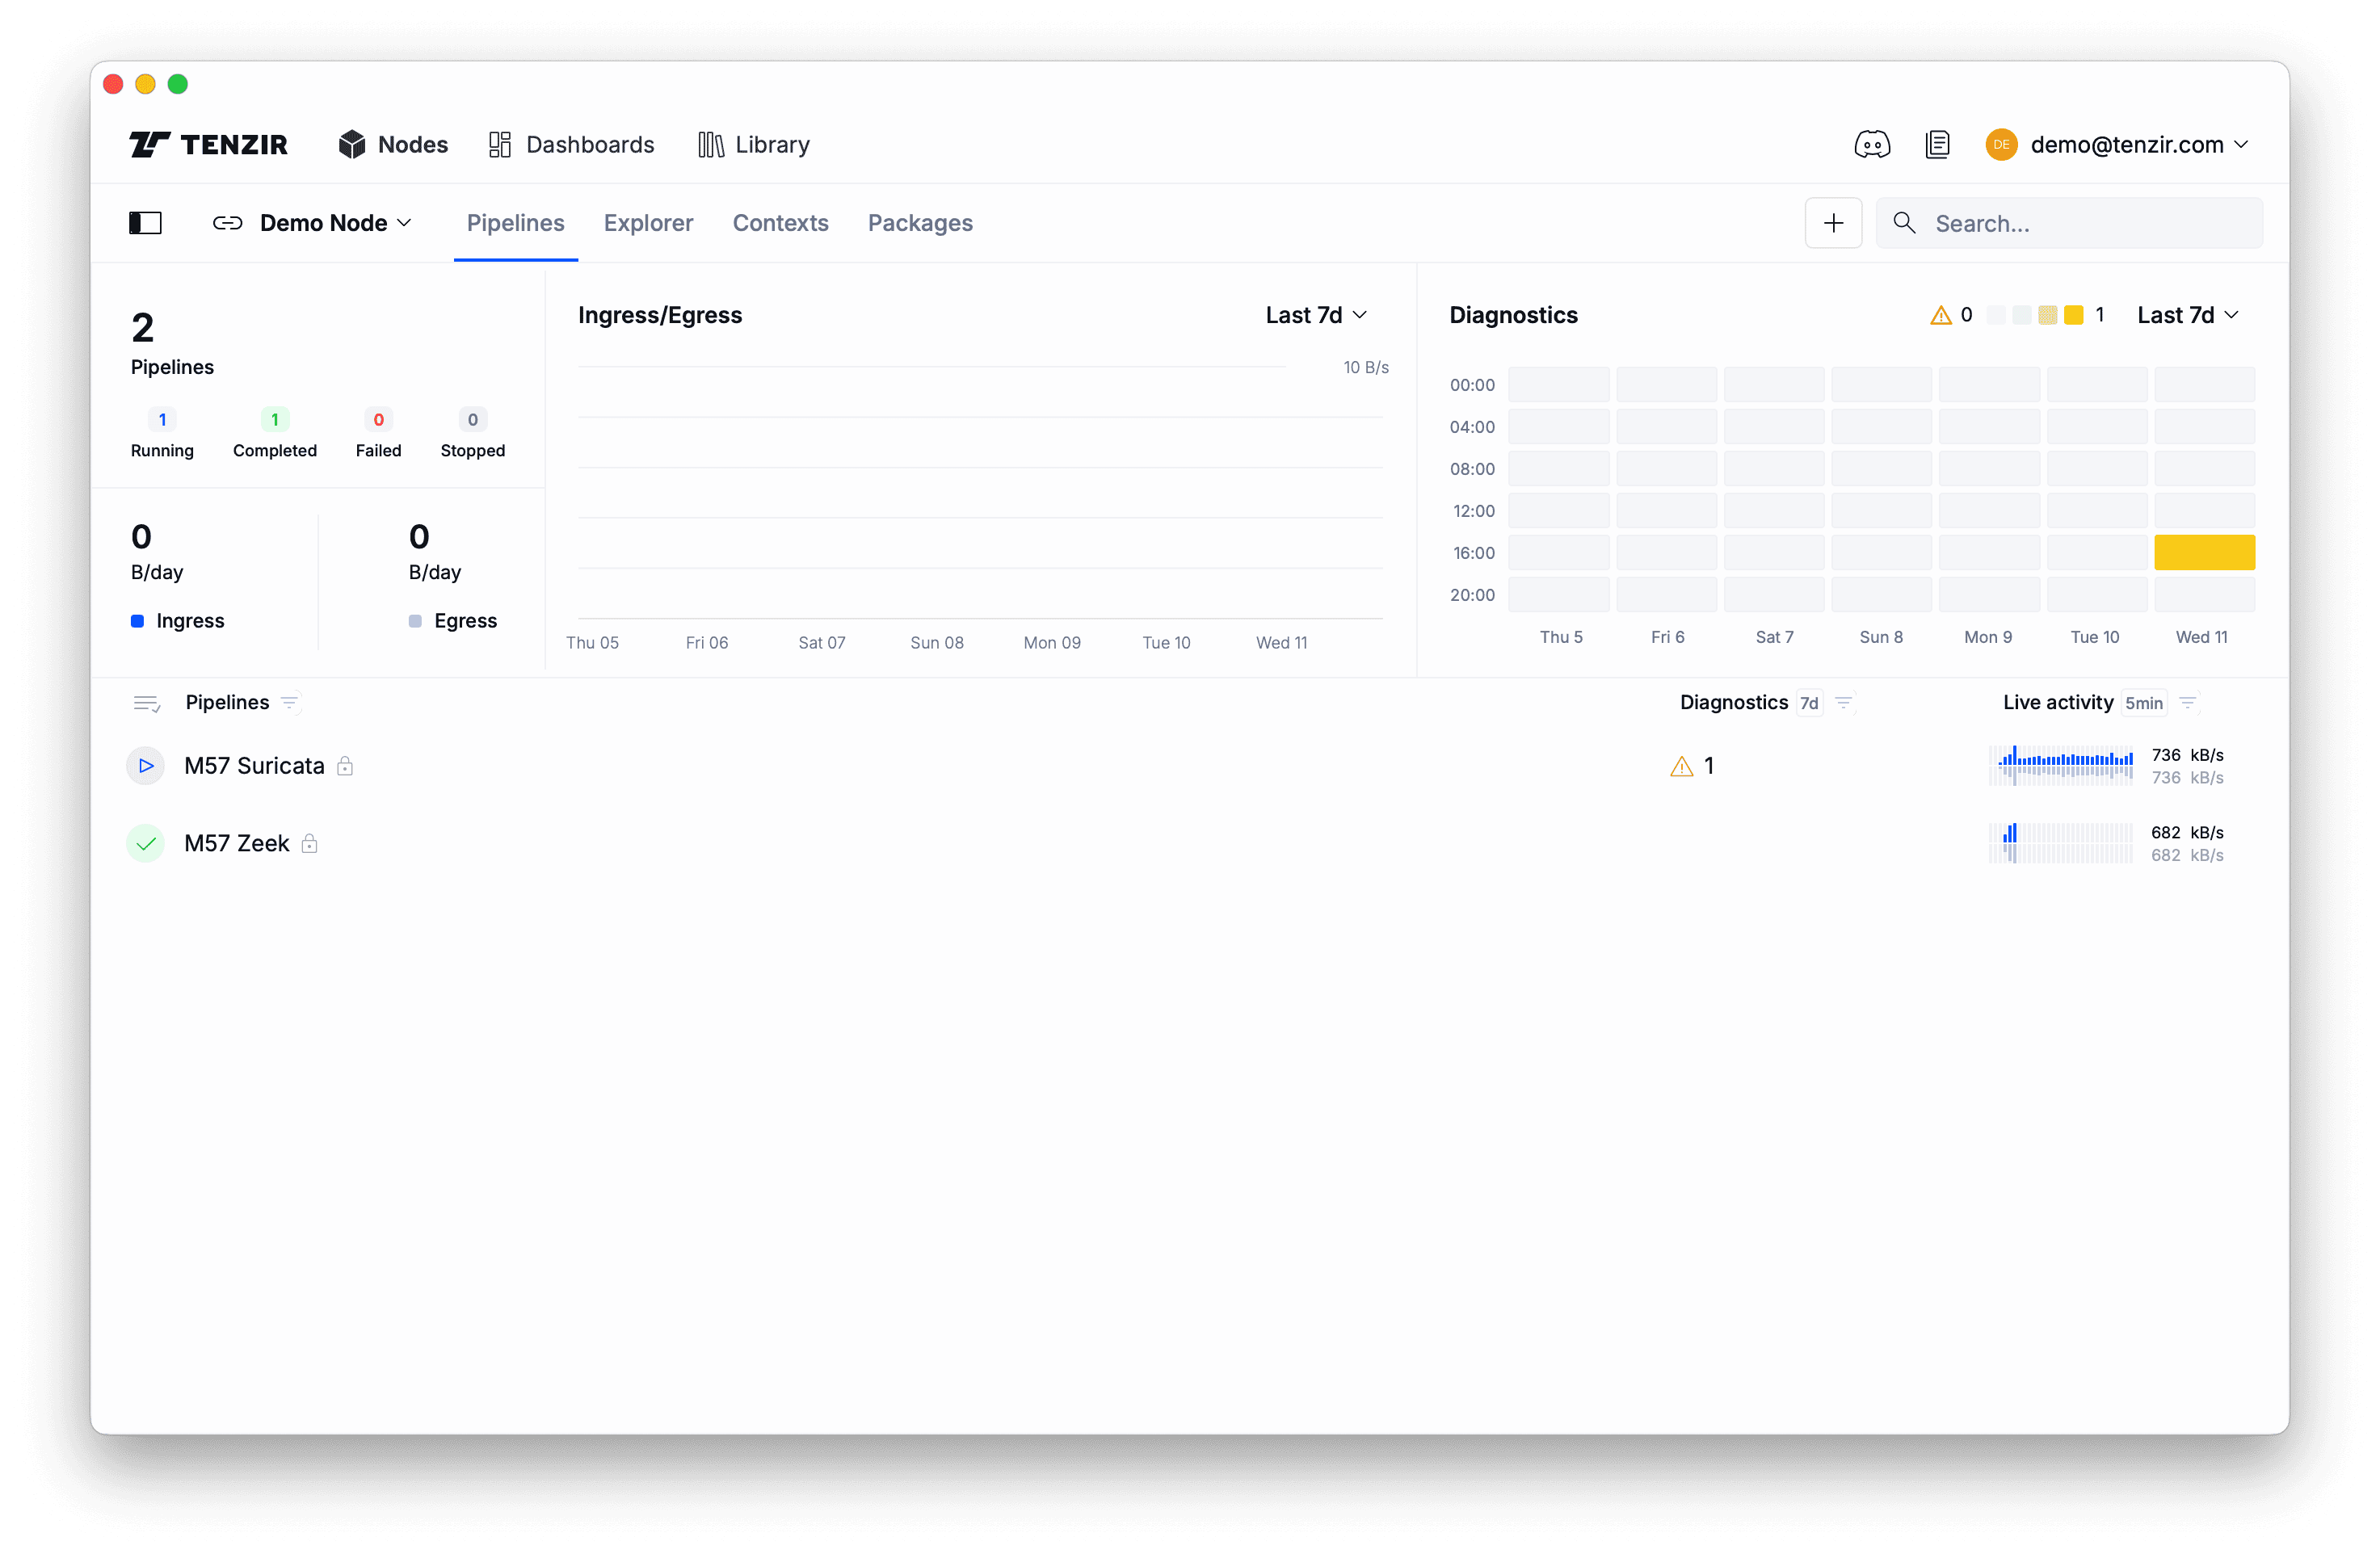
Note the two new pipelines that import data into our demo node. If you click on them, a context pane opens on the right and you’ll see details about their activity as well as the their definition.
Explore the demo data
Section titled “Explore the demo data”The first step in understanding new data sources is getting a sense of their structural complexlity, or simply put, how messy or clean the data is. Let’s take a taste of the demo data. Click the Explorer tab and run this pipeline:
exporttasteThis pipelines does the following: export
references all data in the node’s edge storage, and
taste samples 10 events of every unique schema.
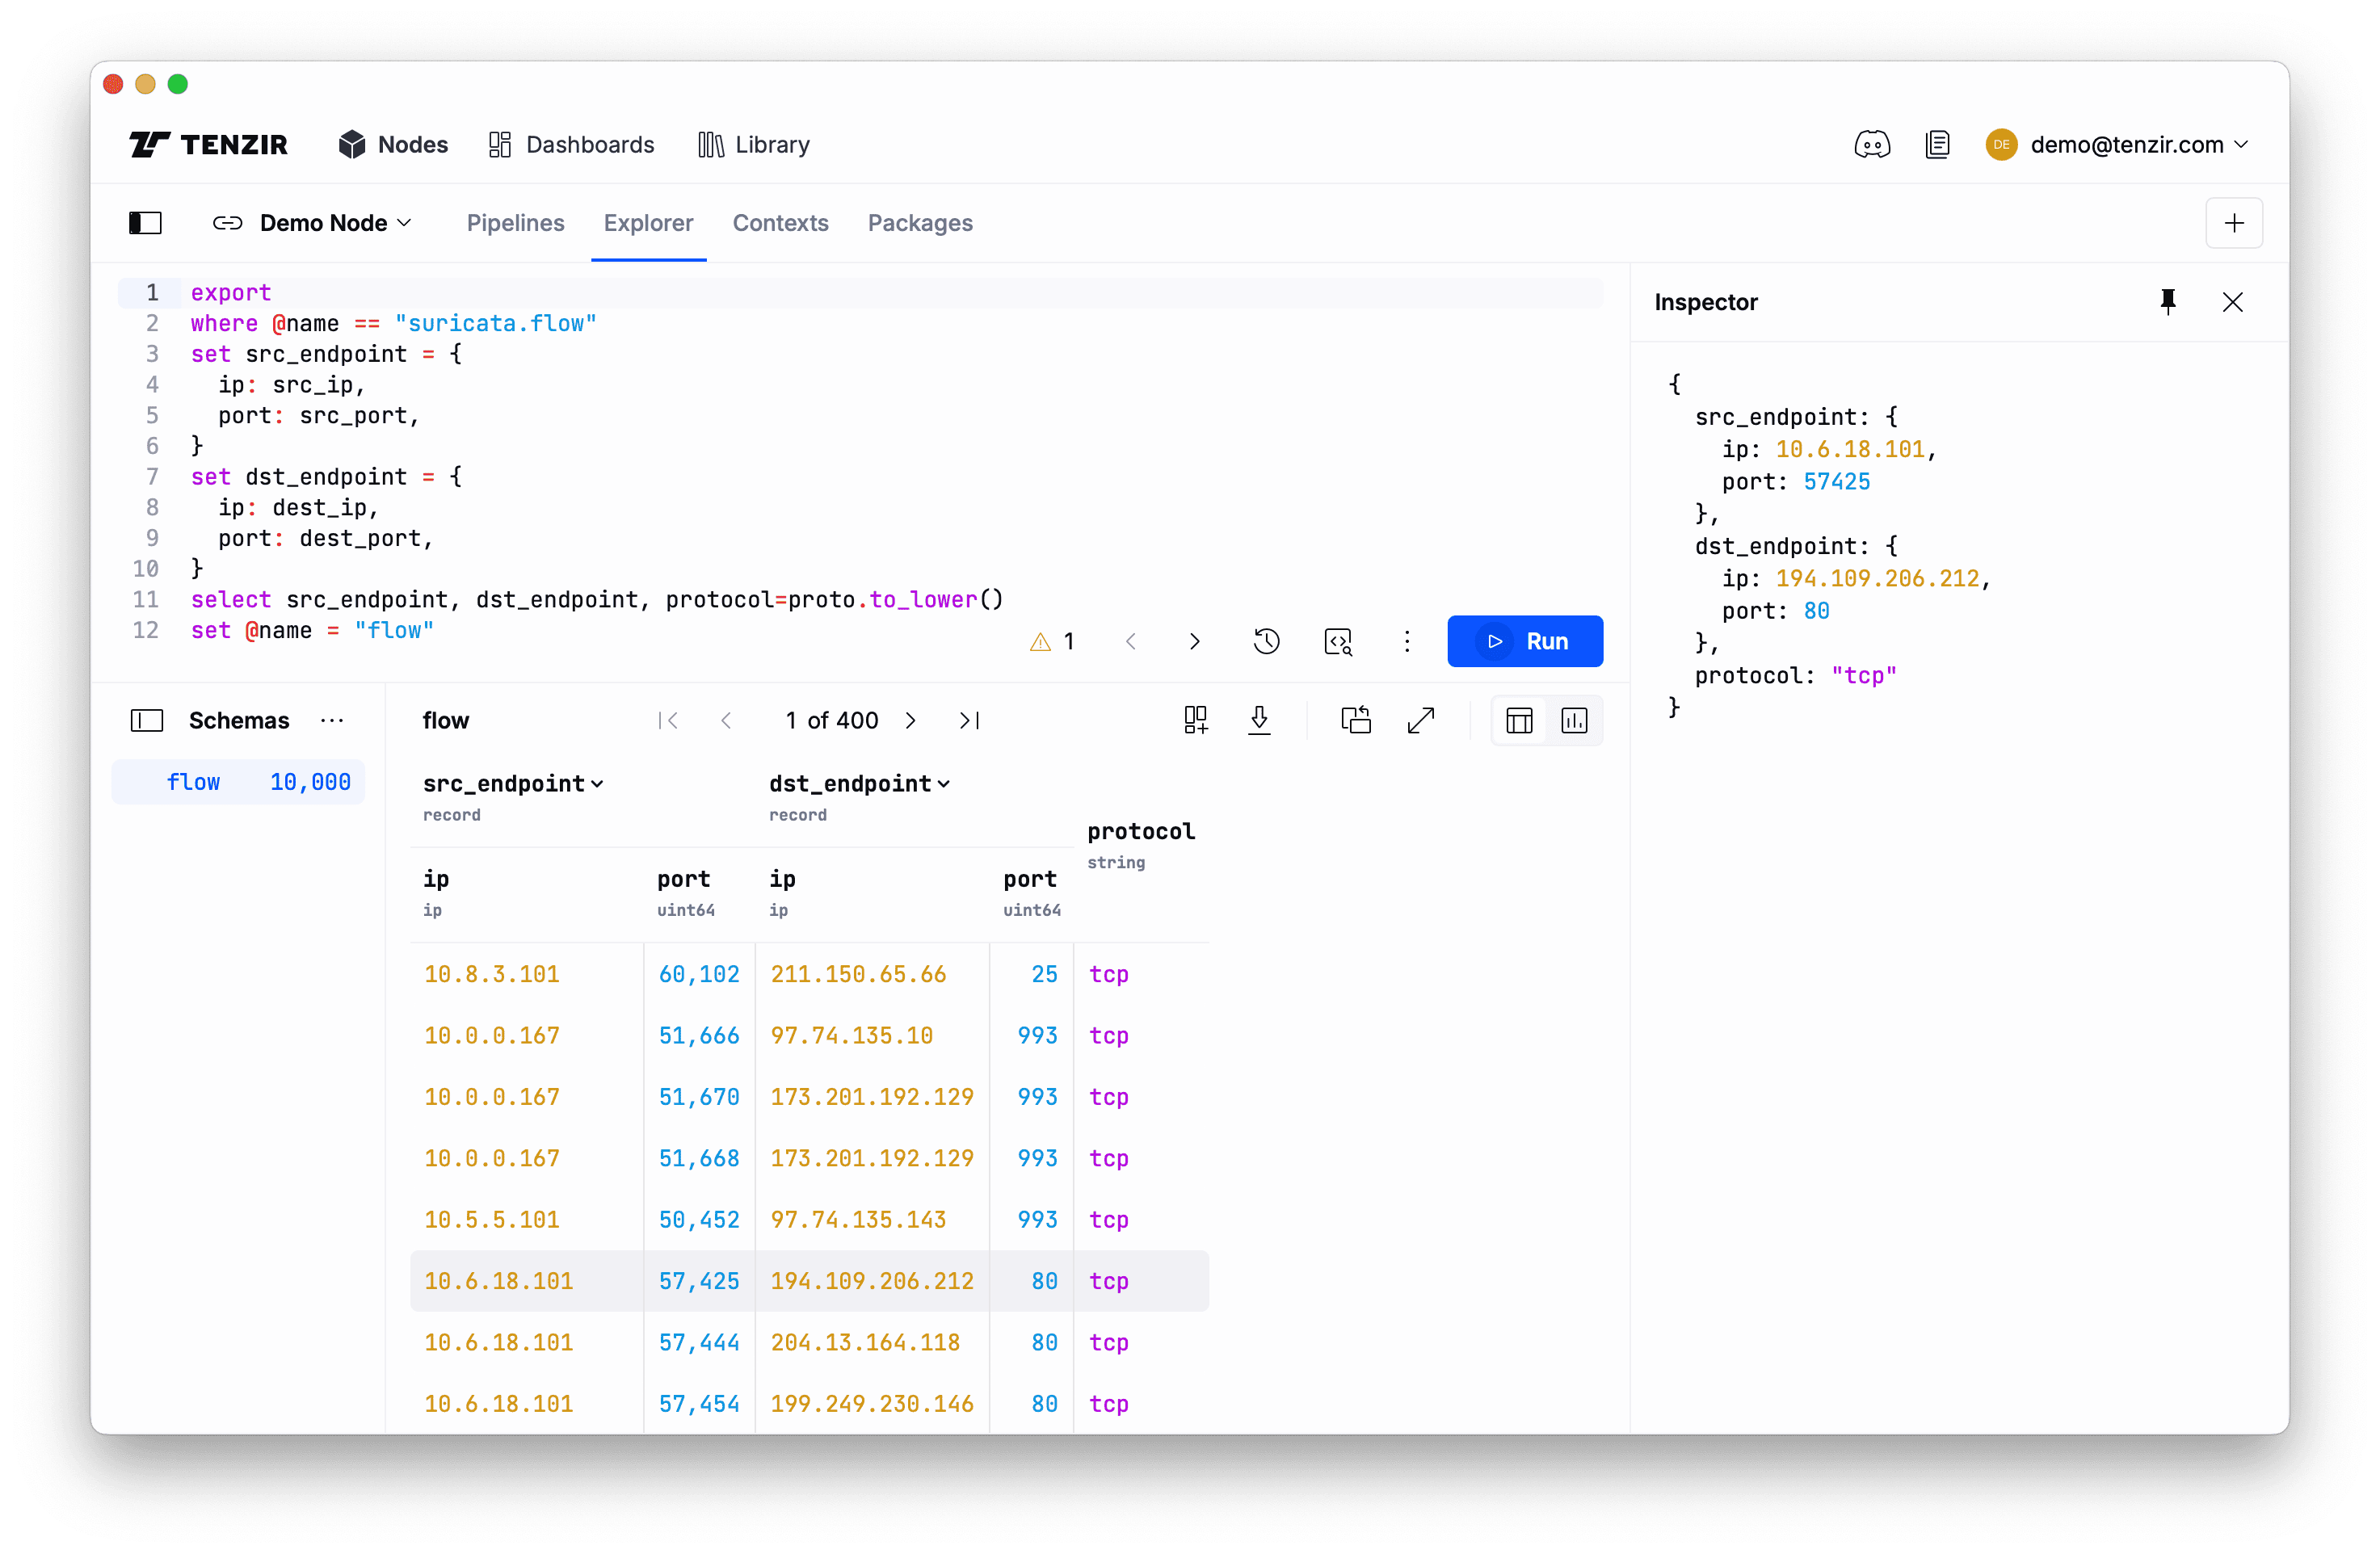
You’ll now see Explorer filling up with events.
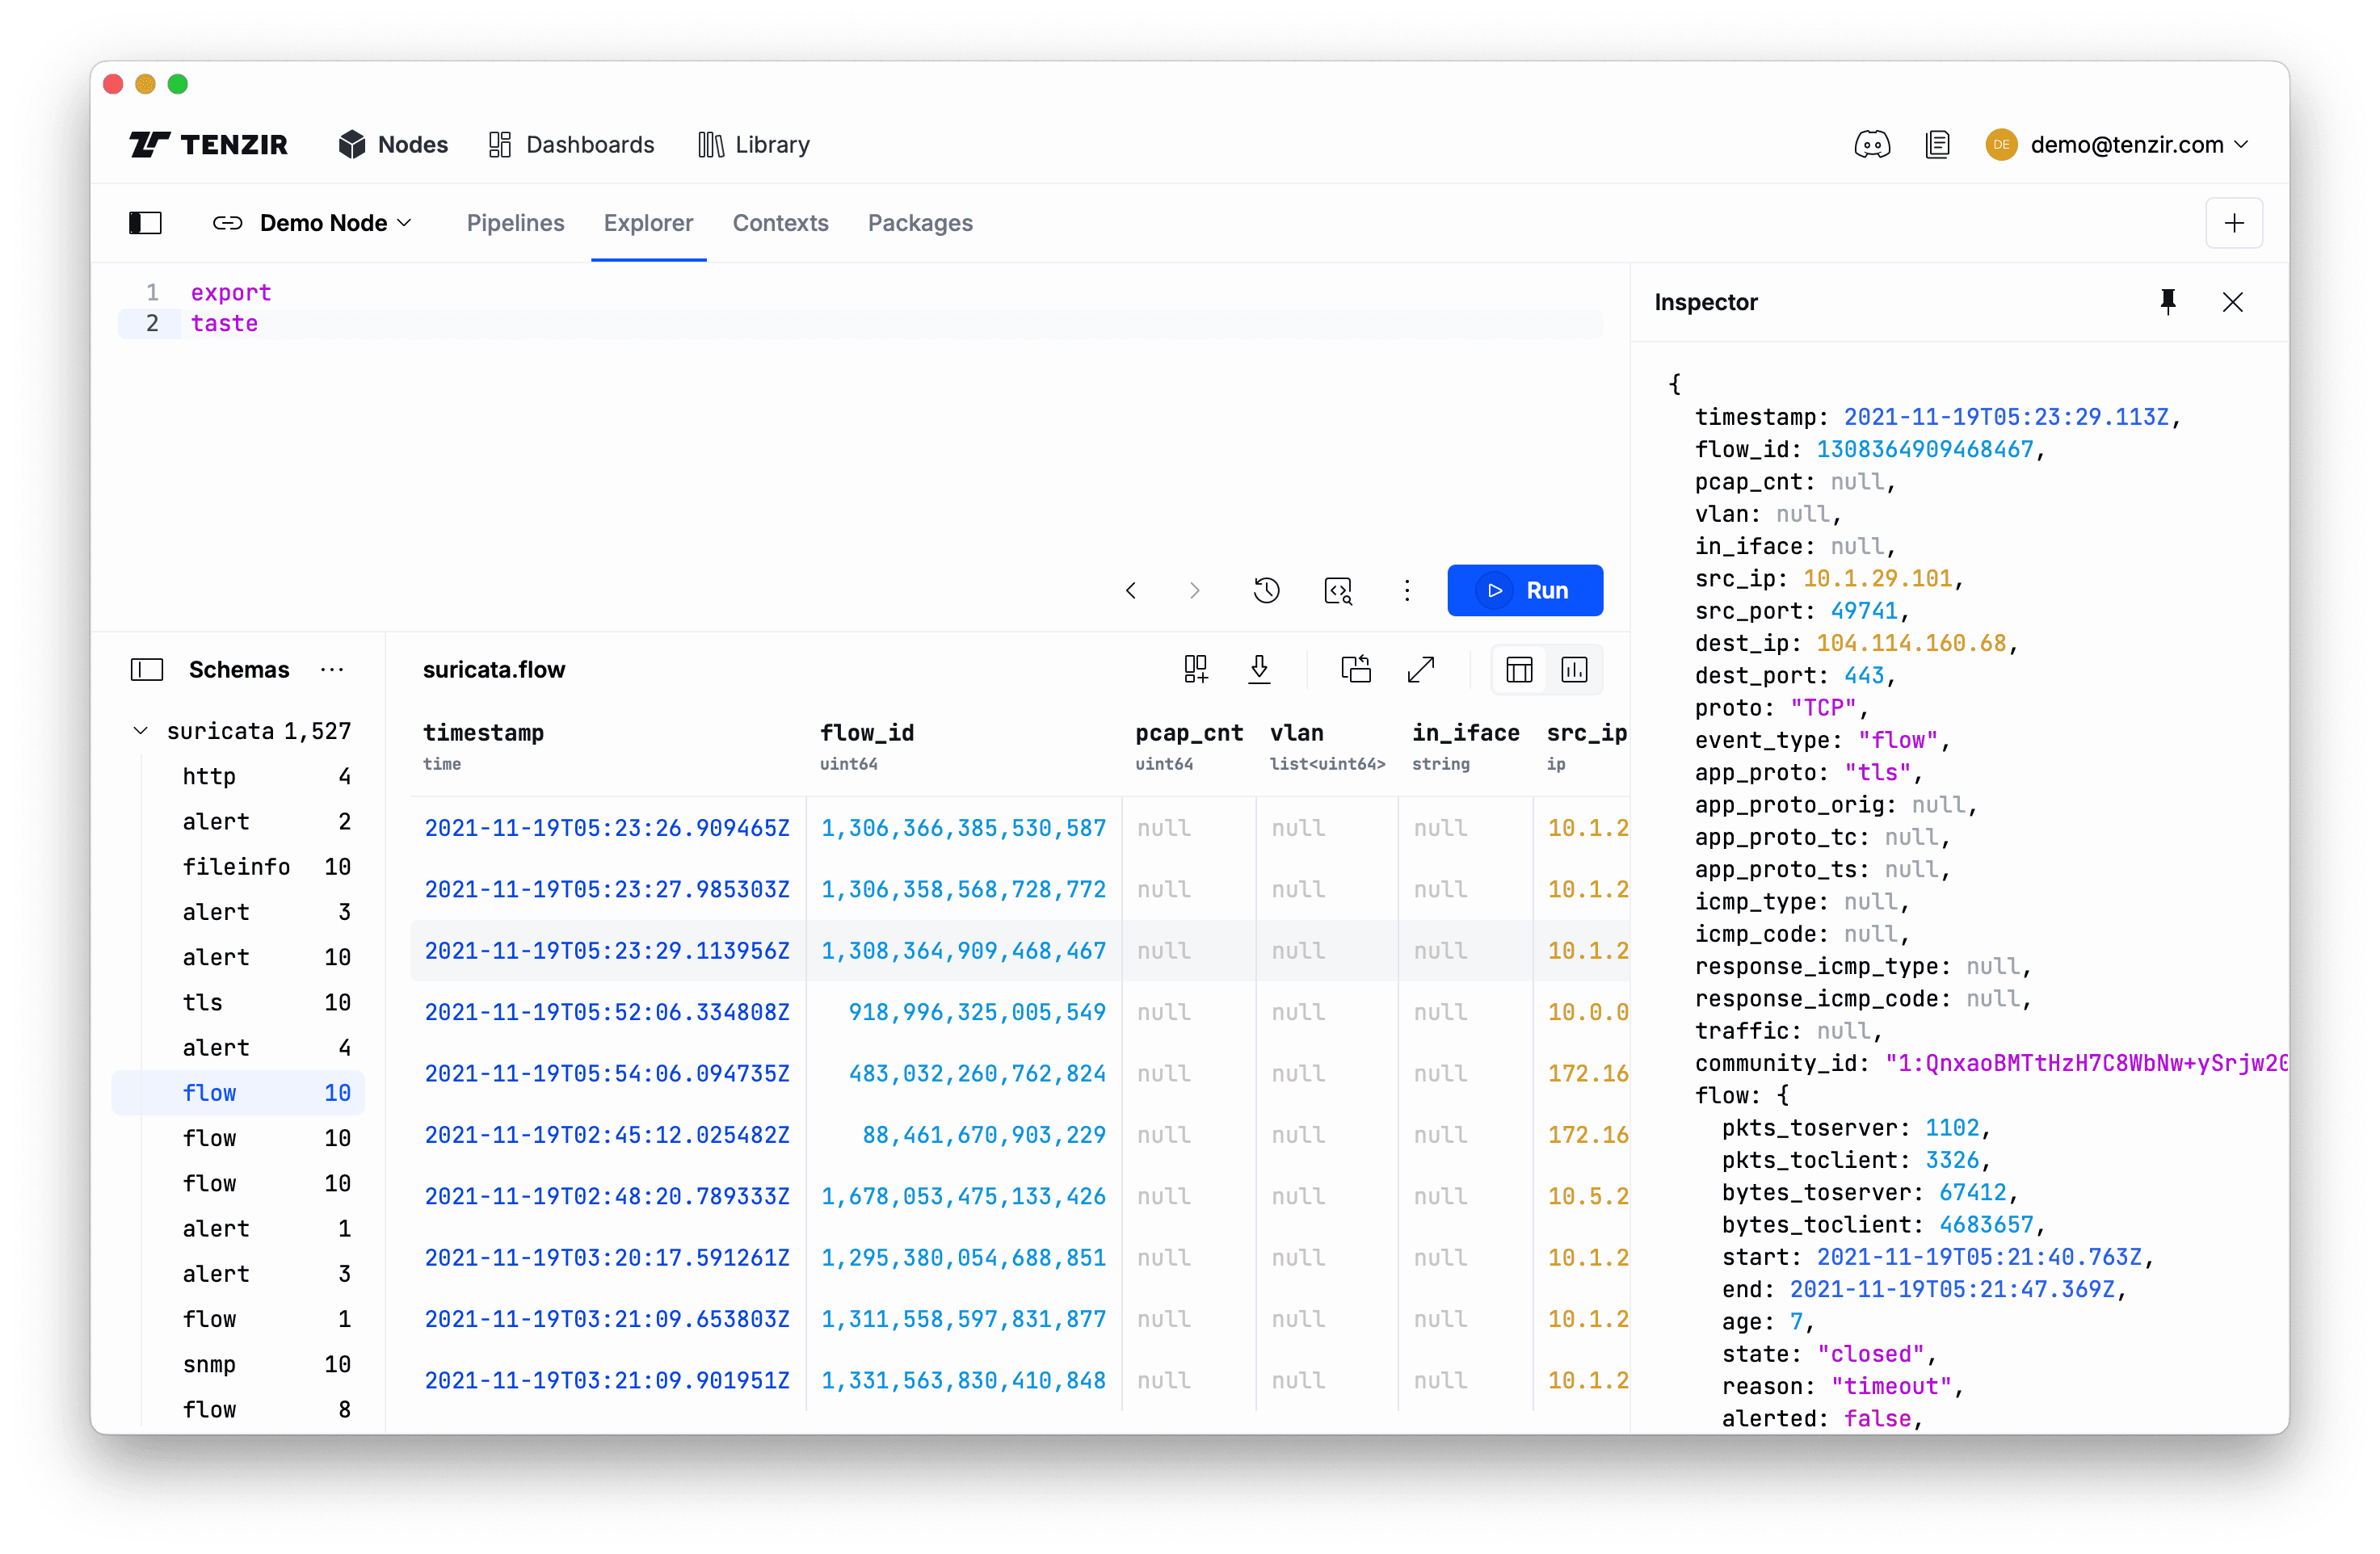
Also note the Schemas pane. It gives you an overview of how heterogeneous the data is. Click on a schema to zoom into all events having the same shape. Later, you’ll learn to normalize the data to make it more homogeneous by reducing the number of unique schemas.
Now click on a row in the results table. The Inspector pops up for a vertical view of the event, which can be helpful for seeing the full structure of an event, especially for wide schemas with many fields.
One more detail: you can uncollapse nested records in the results table by clicking on the column name. This switches from the record-style display to more of a data-frame-style view, allowing you to see more data at once.
Reshape data at ease
Section titled “Reshape data at ease”Now that you have a rough understanding of our cockpit, let’s wrangle that data. This is what we’ve designed TQL for, so it should be fun—or at least more fun compared to other tools.
Begin with selecting a subset of available schemas:
exportwhere @name.starts_with("zeek")Here we filter on event metadata, starting with @. The special @name field
is a string that contains the name of the event. Actually, let’s hone in on the
connection logs only, once for Zeek and once for
Suricata:
exportwhere @name == "zeek.conn"set src_endpoint = { ip: id.orig_h, port: id.orig_p,}set dst_endpoint = { ip: id.resp_h, port: id.resp_p,}select src_endpoint, dst_endpoint, protocol=protoset @name = "flow"{ src_endpoint: { ip: 89.248.165.145, port: 43831 }, dst_endpoint: { ip: 198.71.247.91, port: 52806 }, protocol: "tcp"}exportwhere @name == "suricata.flow"set src_endpoint = { ip: src_ip, port: src_port,}set dst_endpoint = { ip: dest_ip, port: dest_port,}select src_endpoint, dst_endpoint, protocol=proto.to_lower()set @name = "flow"{ src_endpoint: { ip: 10.0.0.167, port: 51666 }, dst_endpoint: { ip: 97.74.135.10, port: 993 }, protocol: "tcp"}A few notes:
- The
setoperator performs an assignment and creates new fields. - Because
setis the most frequently used operator, it is “implied” and you just writex = yinstead ofset x = y. We generally recommend doing so and write it out only out for didactic reasons. - You can use
setto assign schema names, e.g.,@name = "new-schema-name". selectselects the fields to keep, but also supports an assignment to rename the new field in one shot.- As you can see in the
selectoperator (Suricata tab) above, TQL expressions have functions liketo_lower, which makes working with values a breeze.
Now what do you do with this normalized data from these two data sources? It just has a new shape, so what? Read on, we’ll show you next.
Composing pipelines via publish/subscribe
Section titled “Composing pipelines via publish/subscribe”The above example starts with a specific input operator (export) and no output
operator (we used the Explorer). This is useful for explorative data analysis,
but in practice you’d want these sorts of transformations to run continuously.
In fact, what you really want is a streaming pipeline that accepts data,
potentially from multiple sources, and exposes its results in a way so that you
can route it to multiple destinations.
To this end, nodes have a publish/subscribe feature, allowing you to efficiently
connect pipelines using static topics (and very soon dynamic routes). The
publish and
subscribe operators are all you need for
this. The typical pipeline pattern for composable pipelines looks like this:
subscribe "in"// transformations go herepublish "out"Let’s adapt our transformation pipelines from above:
subscribe "zeek"where @name == "zeek.conn"set src_endpoint = { ip: id.orig_h, port: id.orig_p,}set dst_endpoint = { ip: id.resp_h, port: id.resp_p,}select src_endpoint, dst_endpoint, protocol=protopublish "flow"subscribe "suricata"where @name == "suricata.flow"set src_endpoint = { ip: src_ip, port: src_port,}set dst_endpoint = { ip: dest_ip, port: dest_port,}select src_endpoint, dst_endpoint, protocol=proto.to_lower()publish "flow"When clicking the Run button for these pipeline, the events will not show
up in the Explorer because we now use publish as output operator. Instead,
you’ll see this deployment modal:
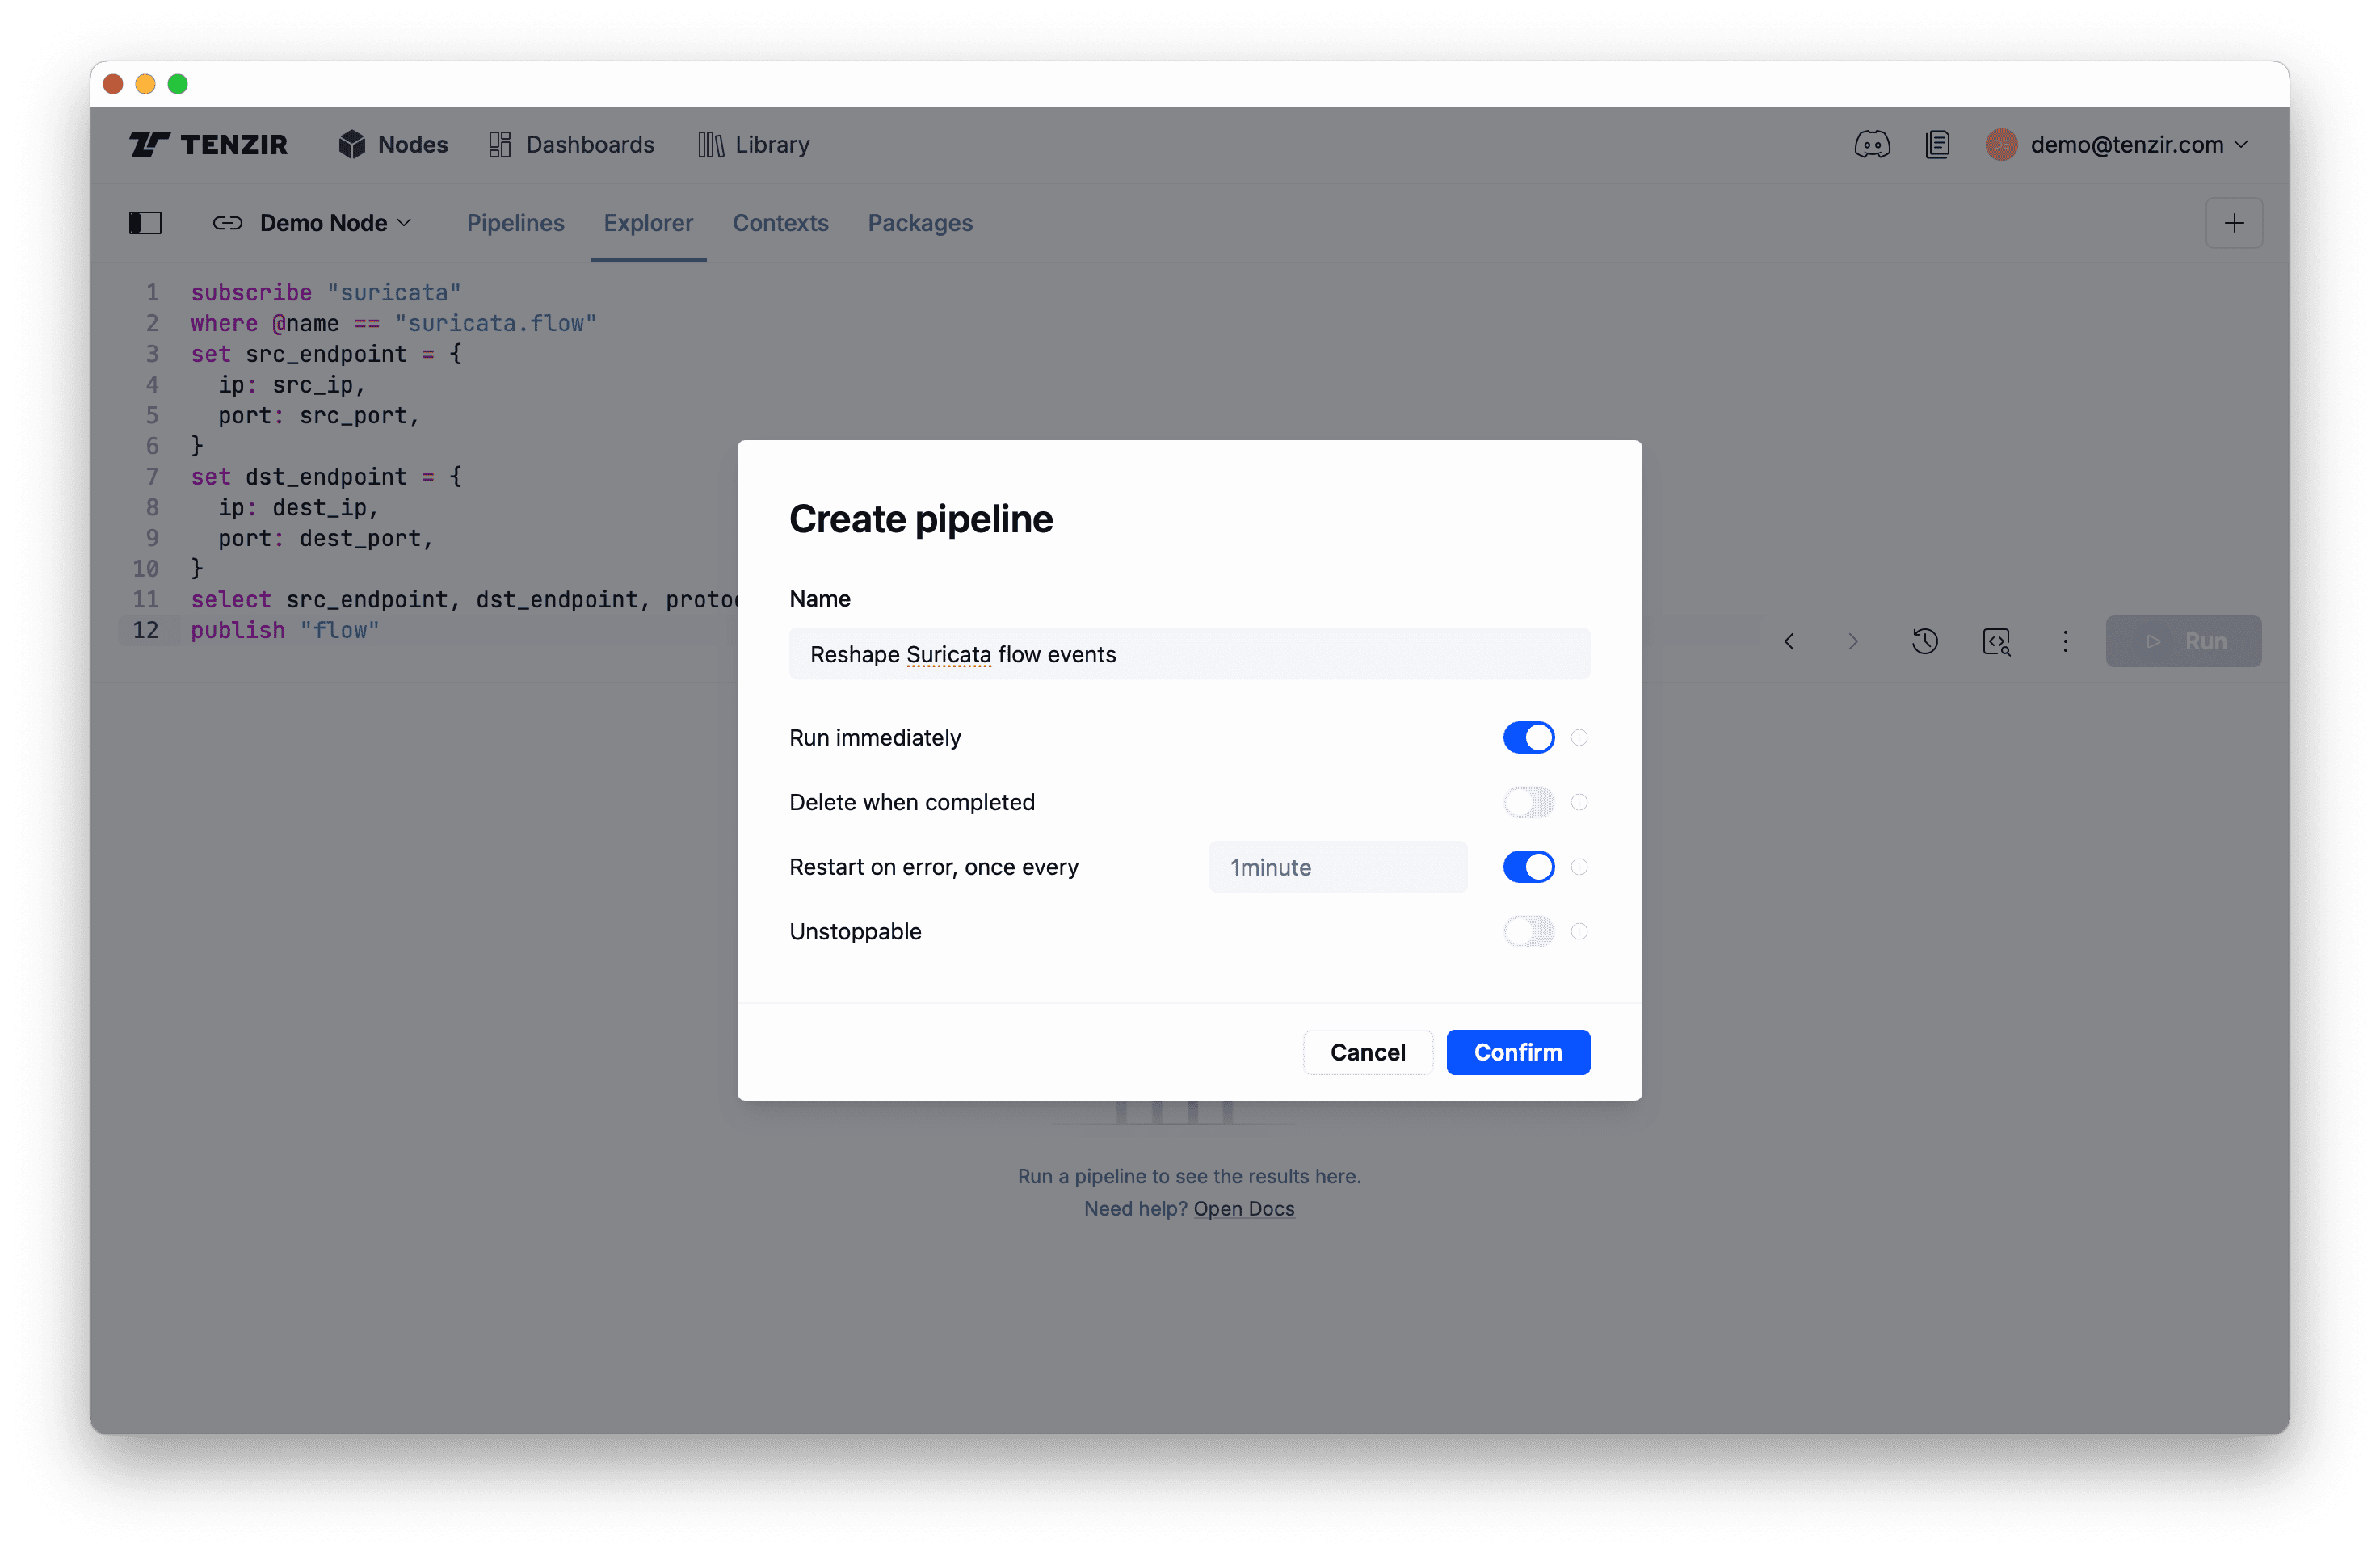
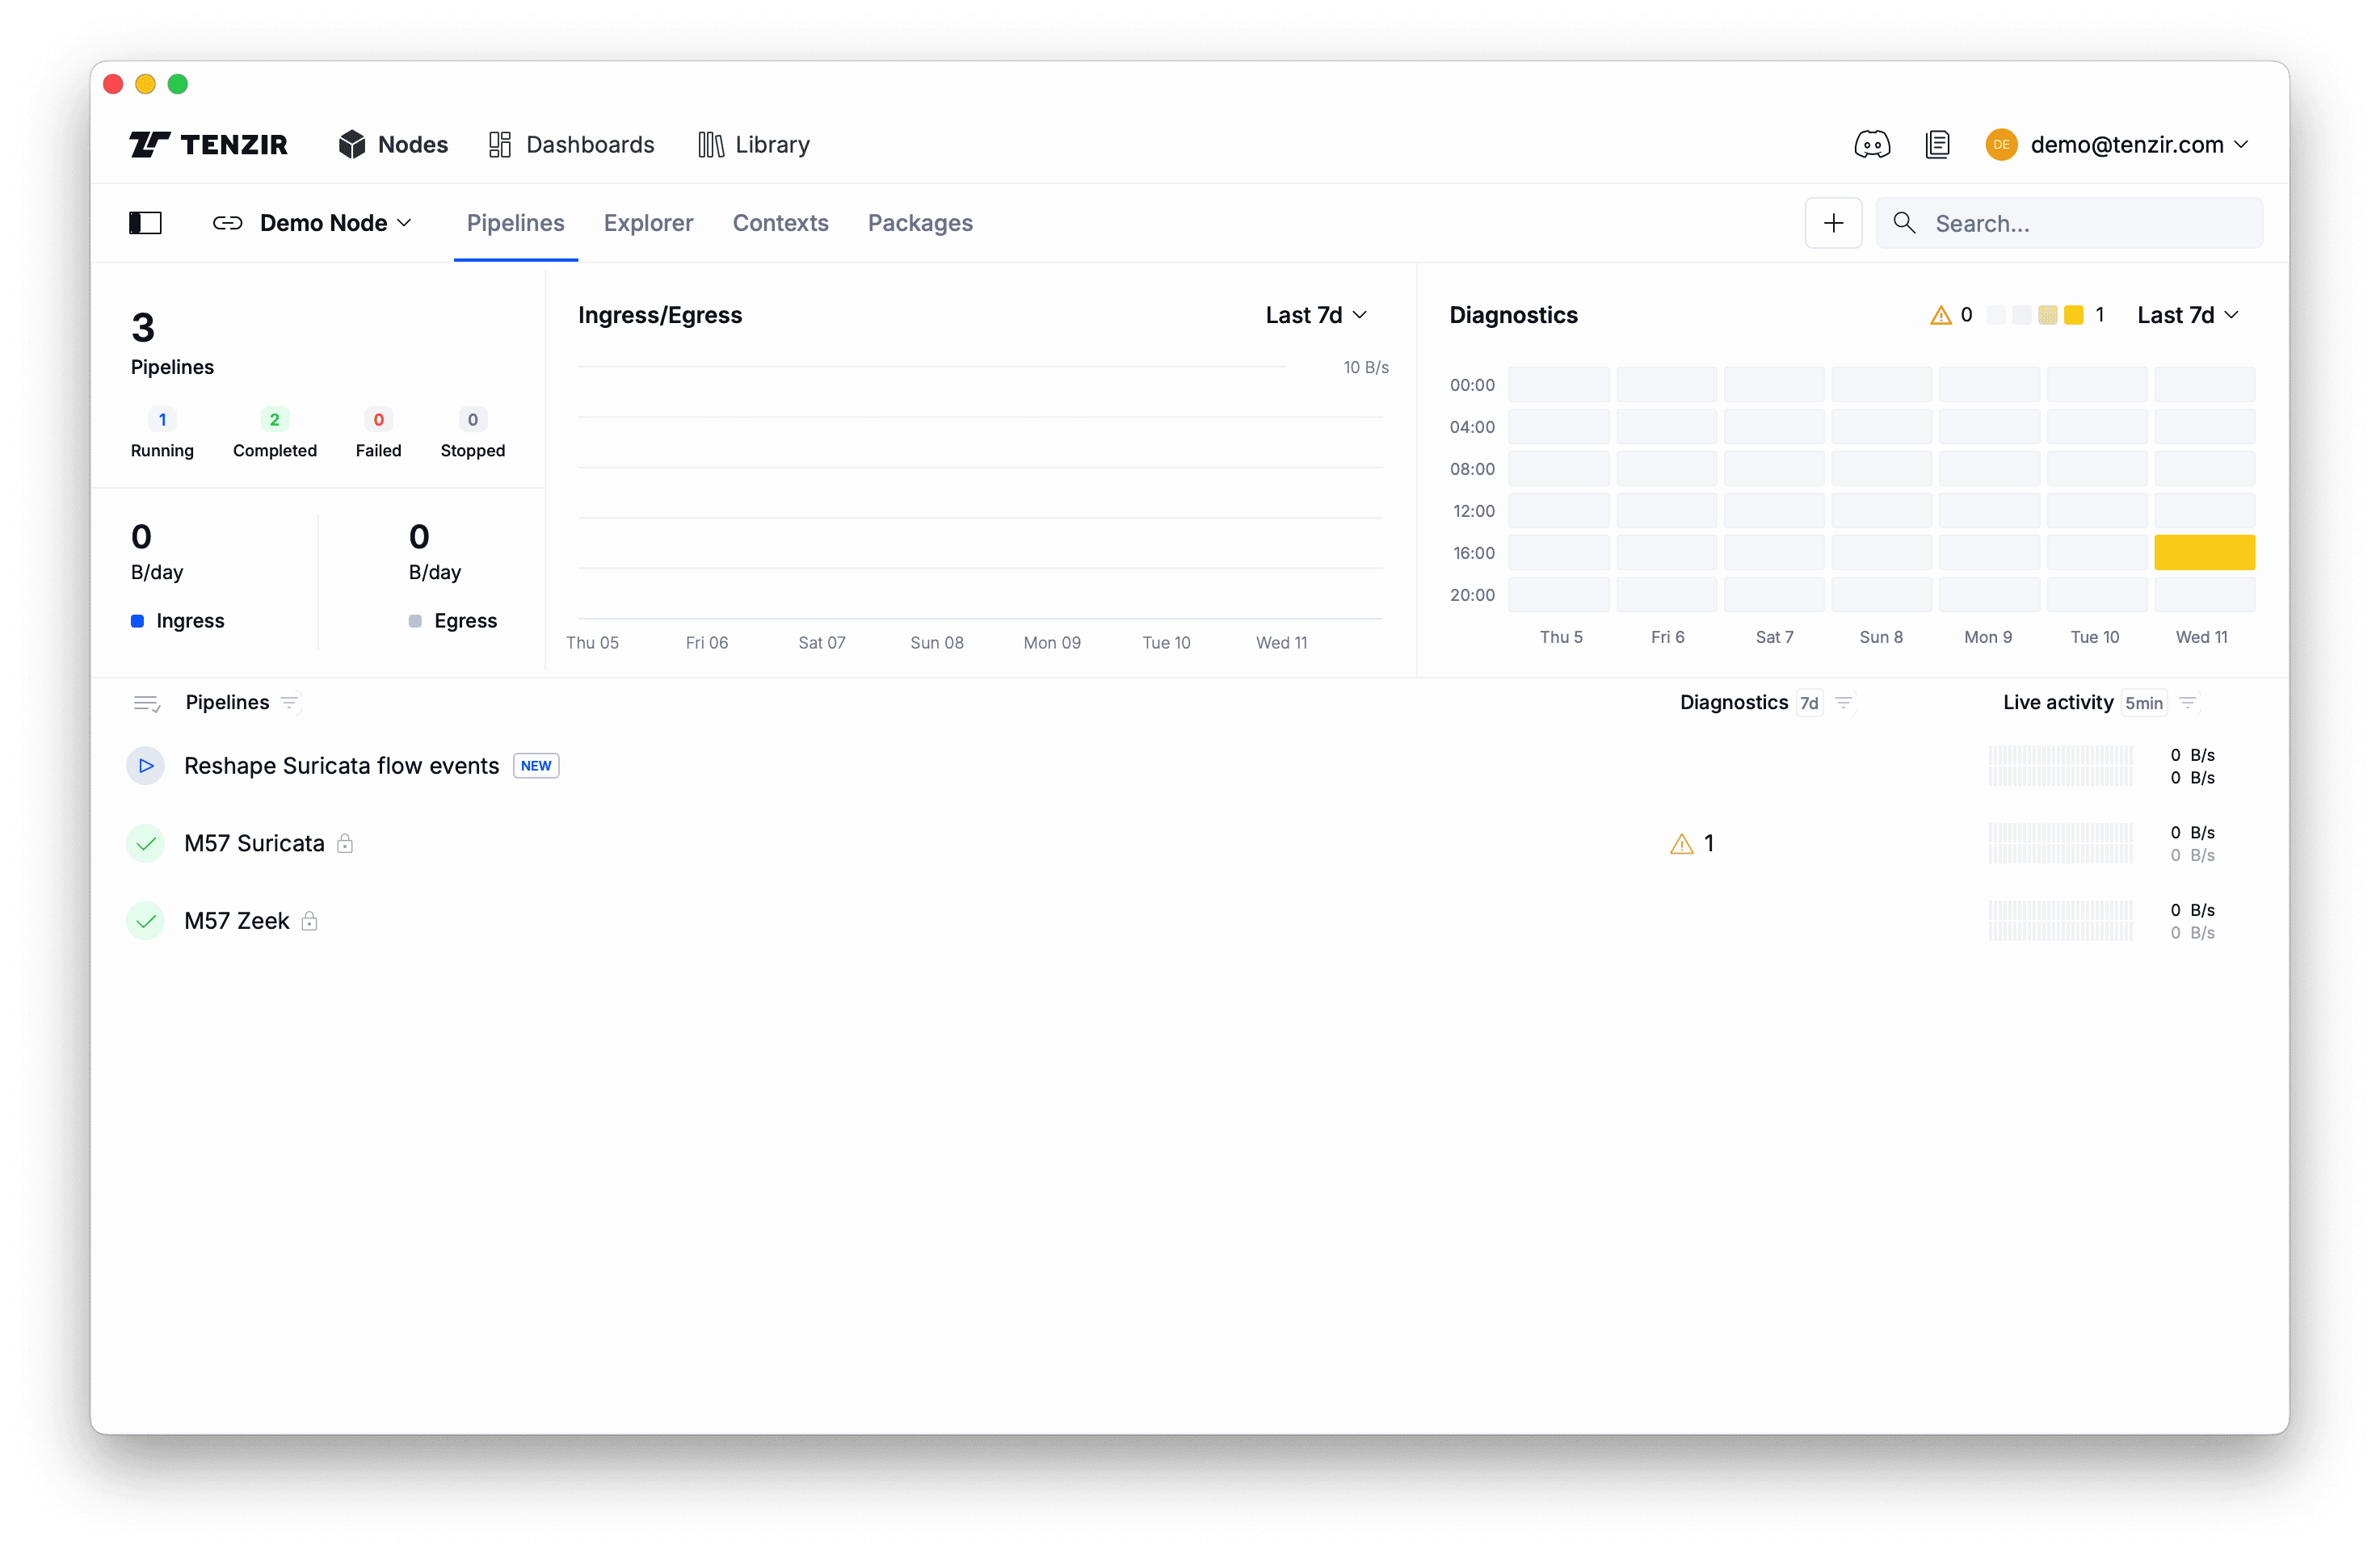
After you give the pipeline a name (or leave it blank for a dummy name), click Confirm to deploy the pipeline. You’ll see it popping up on the Pipelines tab:
Now that you’ve deployed one pipeline with two topics as its “interface,” you can direct data to it from other pipelines. For example, you can create a pipeline that accepts logs via Syslog and forwards them to the transformation pipeline. Then you can write two more pipelines that each take a subset to implement split-routing scenario.
What’s Next?
Section titled “What’s Next?”You’ve just scratched the surface. Here’s where to go next:
- Explore the Library and browse through packages of pre-built pipelines.
- Visualize pipeline insights and build dashboards
- Map your logs to OCSF
- Send events to your data lake, such as Amazon Security Lake
Curious how it all fits together? Brush up on the Tenzir architecture to learn more about all moving parts. We’re here to help. Join us at our friendly Tenzir Discord if you have any questions.